Danışma Hattı
0 (850) 346 33 11
Danışma Hattı
0 (850) 346 33 11
Corporate Carbon Footprint Calculation and Reporting Software.
Border Carbon Regulatory Mechanism (CCRM) Declaration Software.
Sustainability / ESG Reporting and Management Software. (GRI)
Emissions Management and Reporting Software for Cities and Municipalities (GPC)
CimpactPro is a sustainability software family that covers all sectors with its modular structure developed by taking into account the specific needs of different sectors.
Explore All Sectors


With our mentoring, training and research-analysis packages, we build your capacity, finalize processes together and link your decisions to data-based, measurable results.
All Services
Accelerate standards compliance with weekly/monthly coaching and increase your teams' success in error-free implementation and on-time delivery.
Get Detailed Information
With hands-on sessions, it adapts standards and regulations to your corporate data; makes competence permanent and enables rapid implementation.
Get Detailed Information
Green maturity, awareness and GAP measurements link decisions to data and clarify the priority roadmap and KPIs.
Get Detailed InformationFrom technical guides to expert opinions, from analysis of current legislation to software support tools, CimpactPro Resources library has all the information you need to take firm steps towards your sustainability goals.
Kozyatağı Mah. İbrahim Ağa Sk. Som Plaza Kat:5 Kadıköy/İstanbul/TÜRKİYE
A Closer Look at the CimpactPro CBAM Module: How Does It Streamline Your Reporting Process?

Easy and Fast Reporting Guide with CimpactPro CBAM Module
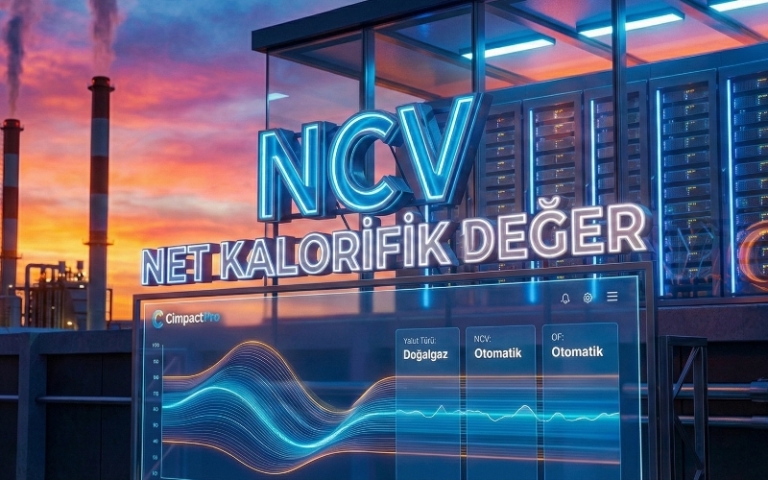
Borderline Carbon Adjustment Mechanism (CBAM) means a new and complex reporting process for companies. CimpactPro's CBAM module is a comprehensive solution designed to simplify this process, make the data understandable and guide the user every step of the way. Let's take a closer look at the key features this platform offers, from its homepage to report management, supplier registration and support tools.
Command Center Home Page and Instant Analytics
When you log in to the software, you are greeted by a home page that provides an instant summary of your entire reporting process. This screen acts as a command center.
- Overview: The home screen contains key information about your reports to date: total emissions, monetary amounts of those emissions, average emissions intensity per product, and the number of completed or incomplete reports.
- Dynamic Graphs: Three dynamic graphs on the page allow you to visualize your data in real time
- Product Based Graph: Clearly shows which of your products generates the most CBAM burden.
- Periodic Graph: Allows you to analyze your emissions by periods. for 2025, this structure will appear as four quarters, and from 2026 it will become a single annual chart.
- Source Based Chart: Shows the source of your emissions in percentage terms.
Report Management: Organized, Filterable